Observe
Production APM — logs, metrics, traces & SLOs, bundled.
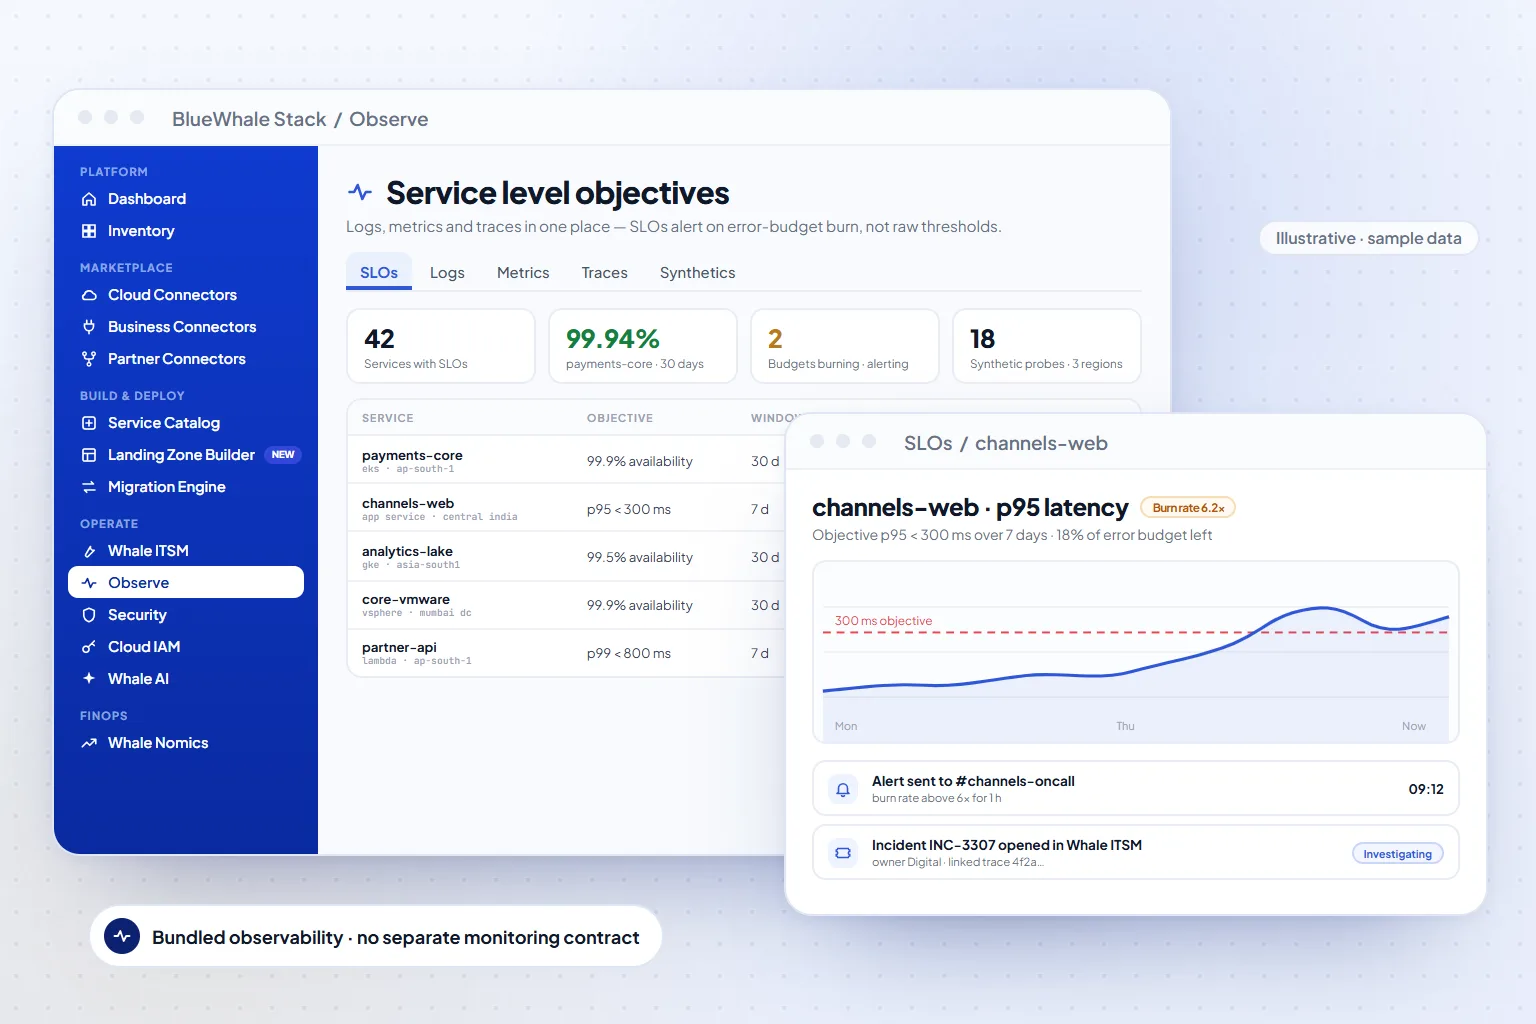
Observe bundles production-grade observability into the platform — logs, metrics and traces in one place, SLOs with burn-rate alerting, synthetics, usage metering and notification channels — so teams get full observability of the estate without procuring and stitching a separate monitoring contract.
- Logs · metrics · traces
- One data model, one query surface
- SLOs
- Error budgets with burn-rate alerts
- Bundled
- Included in Standard & up — no separate contract
Capabilities
What Observe does
Unified telemetry
Ingest logs, metrics and traces from cloud services and agents into one store, correlated with the inventory so a signal always resolves to a workload and an owner.
SLOs and burn-rate alerts
Define availability and latency objectives per service; alerts fire on error-budget burn rate, not raw thresholds, which cuts noise and pages the right team.
Synthetics and metering
Probe endpoints from your regions, and meter usage per tenant or business unit — the same numbers Whalenomics and Tenancy use for billing.
Notification channels
Route alerts to email, chat and on-call tools, and open ITSM incidents automatically for SLO breaches.
How it works
3 steps, from first connection to steady state
Ingest
Cloud-native telemetry via provider APIs; agents and OpenTelemetry for applications; the Edge Agent for on-prem.
Define objectives
Set SLOs per service with the platform suggesting baselines from observed behaviour.
Alert and act
Burn-rate alerts route to channels and ITSM; dashboards and traces are one click from the incident.
Where it fits
One module of one platform
Shared platform
Capabilities
- Logs, metrics & traces in one place, correlated to the inventory
- SLOs with burn-rate alerting
- Synthetics & usage metering
- Included in the platform licence — no separate observability contract
Included in
Solutions that use it
Industries that rely on it
Questions
Questions teams ask before turning it on
Scope, permissions and maturity — answered the way we answer them in an evaluation.
01Does Observe replace our APM tool?
For most teams it removes the need for a separate contract: logs, metrics, traces, SLOs and synthetics are bundled. If you keep an existing tool, its alerts can still open incidents in the platform.
02How do you keep alert noise down?
Alerts are based on SLO error-budget burn rate rather than static thresholds, and correlated to workloads — one incident per real problem, routed to the owning team.
03Is telemetry stored in-region?
Yes. Telemetry follows the deployment's data residency: your chosen region on SaaS, your accounts on BYOC, and never leaves the perimeter on sovereign deployments.
See it on your data
Observe, on your own estate — in one working session.
Bring one cloud account or one on-prem site. We connect it read-only during the call, walk the module on your real resources, and leave you with the export.